Reports
Reports
Now that you’ve sent a presentation campaign, you can view the analytics in real-time.
Select the campaign from the sidebar and the Reports view mode from the tabs:
- General
- Clients
- Slides
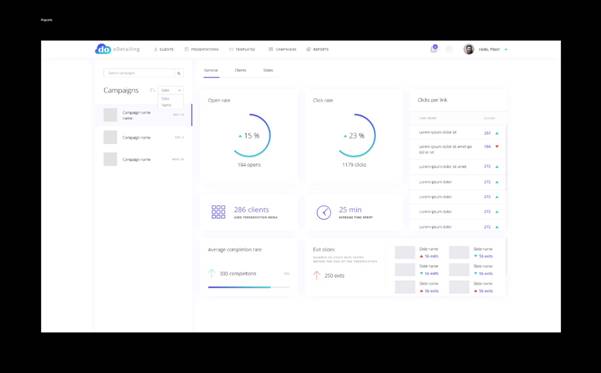
The General tab gives you information about the campaign open and click-through rates, clicks per each link in your presentation, average time spent on presentation, total number of people who’ve used the navigation menu, average completion rate and a list with the exit slides.
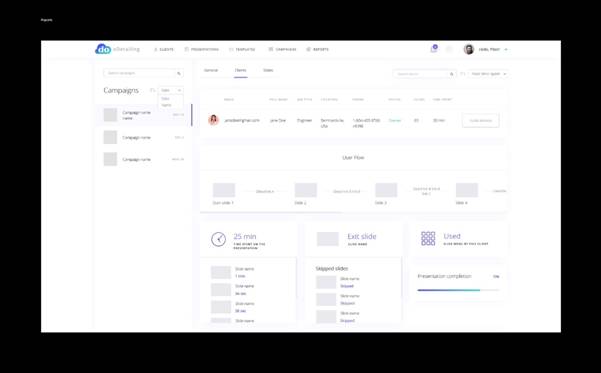
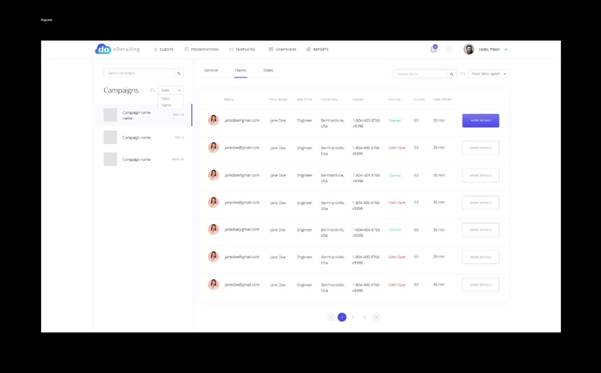
The Clients tab gives you detailed information about each subscriber the campaign was sent to. Click on the More Details button and you will be able to analyze the exact user flow throughout the presentation, what links the client has clicked on, time spent on the presentation, if the navigation menu was used and what is the Exit Slide.
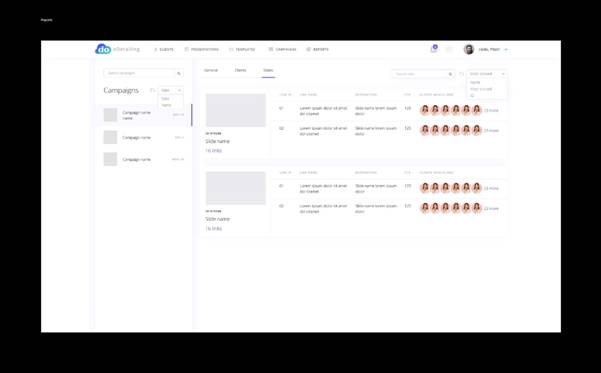
The last Reports tab is the Slides statistics, which shows you detailed analytics per each one of your presentation’s slides.
